While supporting your network with hiring, your job board is a key asset in making hiring needs visible. Companies in your network are asking you to connect them with great talent. They have the money, and now they need to hire high performers to grow. Getro analytics will help you answer the following questions:
- How many people are visiting my job board?
- What jobs or companies are viewed the most?
- What types of jobs are companies in my network hiring for?
- How many introduction requests are being sent between companies and talent members?
The Analytics page in the admin portal provides insight to help you measure engagement with your job board and talent network.
Why utilize analytics?
- You get a much better overall understanding of how your job board is performing.
- You can make solid, data-driven decisions faster and easier.
- You can prove the success and viability of your organization to stakeholders and investors.
- You will have powerful insight into the marketing channels that are bringing the majority of applicants or employers to your job board.
What can I do within the analytics page?
- See metrics related to jobs' and companies’ performance
- Select between trending data and detailed reports
- Customize the timeframe and interval of the metrics you are viewing
- Download raw data for your own analysis
Learn how to find, navigate, and export your analytics
- Log in to your admin portal
- Once you have logged into the admin portal, at the top of your screen, select Analytics

Navigating the Analytics page
Your Analytics page consists of your report configuration options and a report view. The report view will display your data in either Trending Report View or Detailed Report View depending on your selections.
- Configure Report - Customize the analytics report to view and analyze the data according to your needs. You can filter report data, change which metric is presented, select a timeframe, and choose the interval in which the data will be displayed.
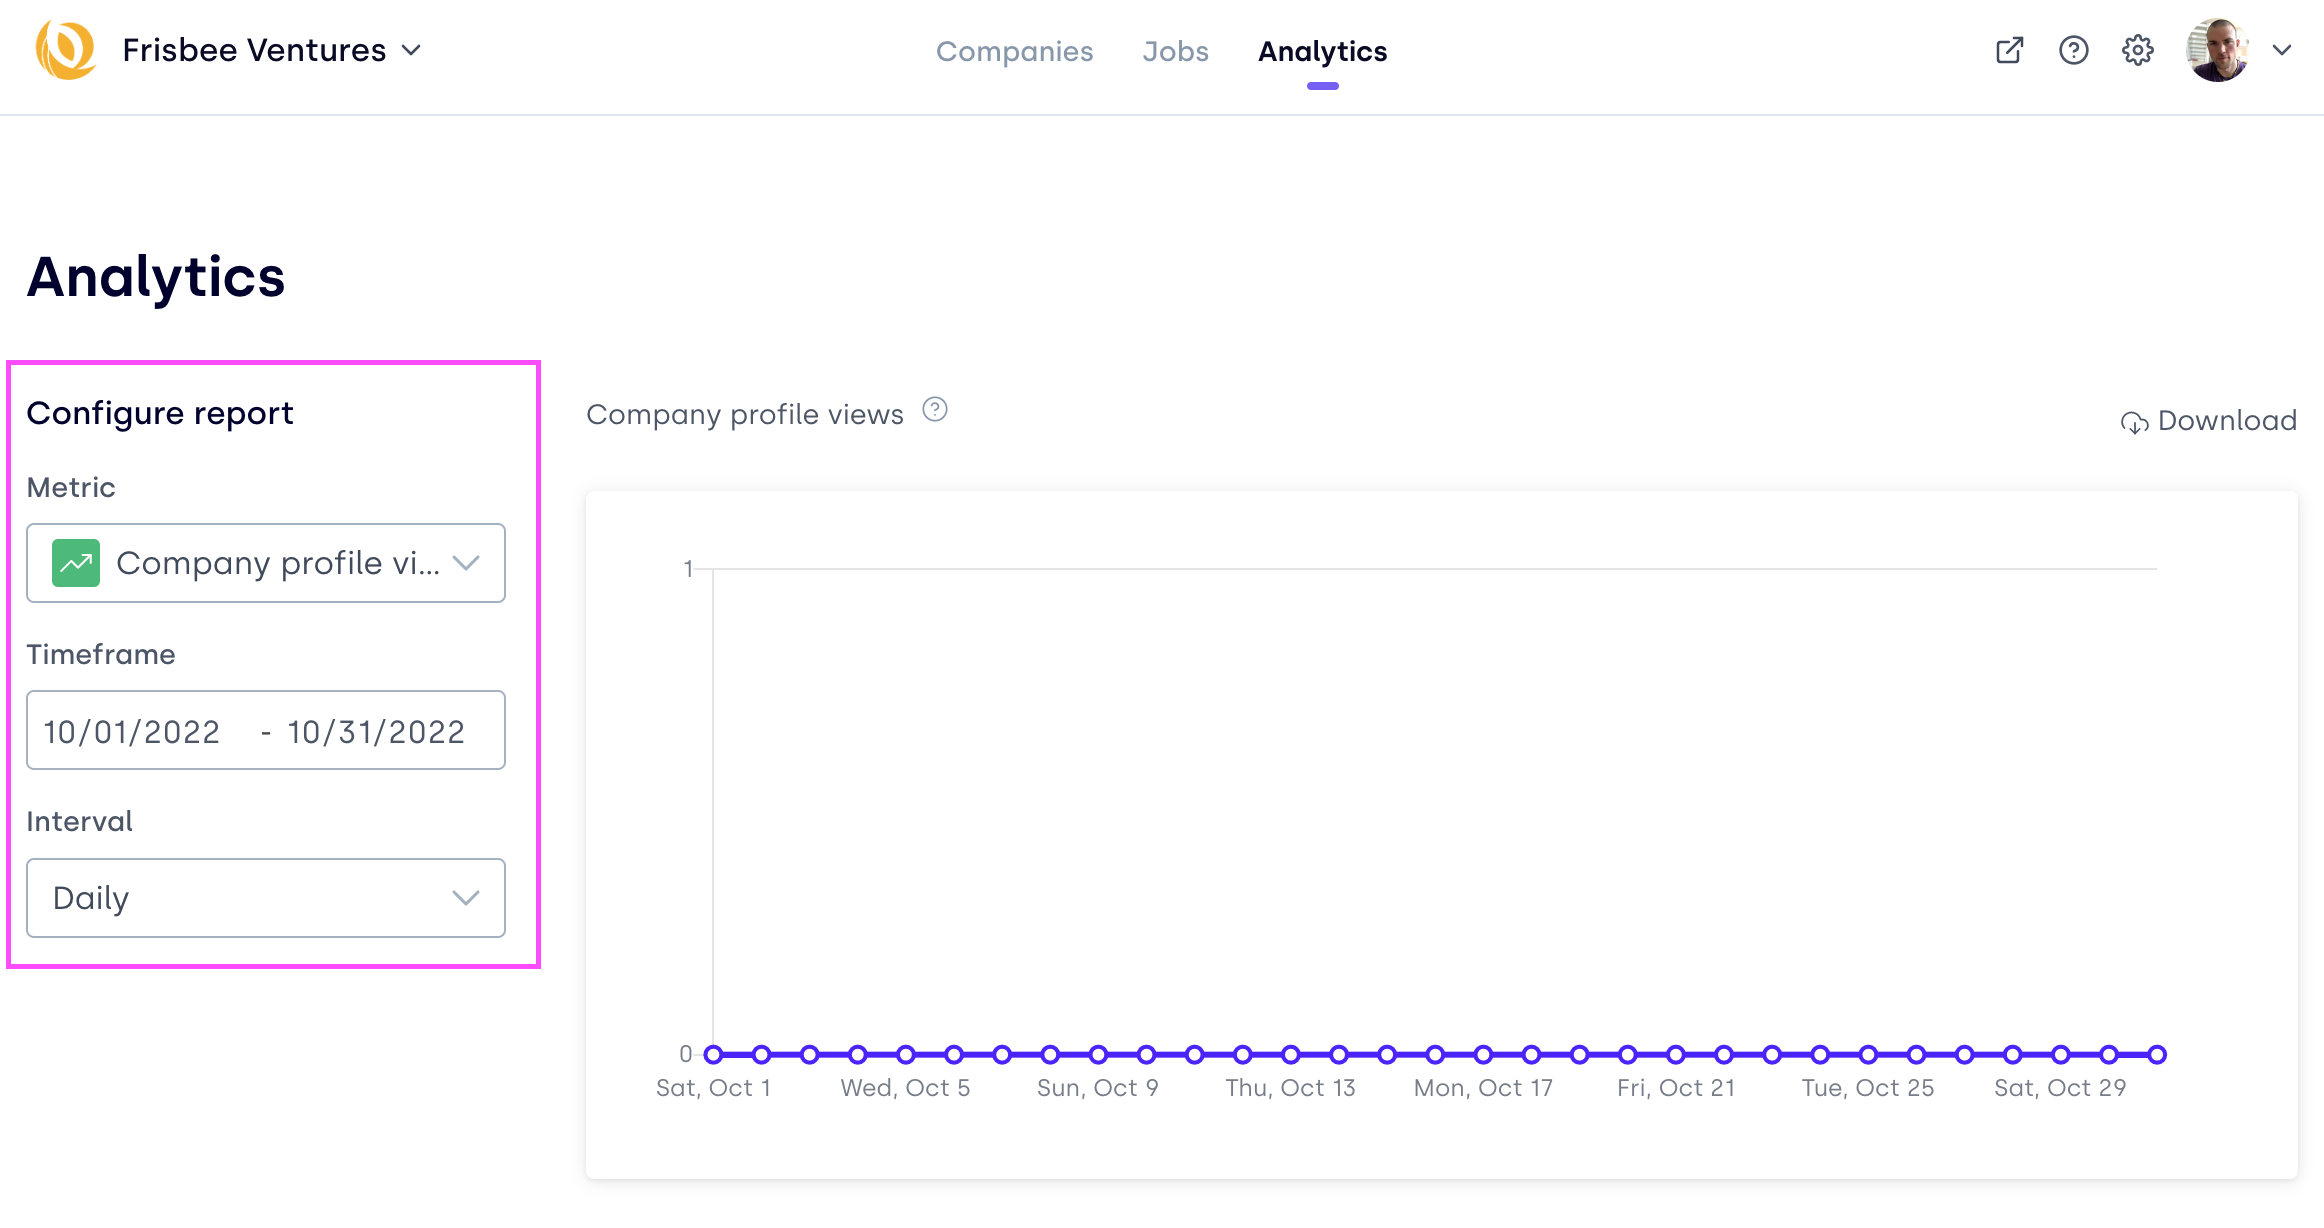
- Metric - This dropdown list consists of all metric report data including Unique Visitors, Company Profile Views, Jobs Click, and New Jobs, and several other valuable options. For specific definitions of each metric, view the Glossary.
- Timeframe - This option will allow you to select a preset (e.g. Last 7 days) or define your own (e.g. Jan 2-10 in calendar view) window of time to view the data of your selected metric. For example; if you select the timeframe, "Last 60 Days", you will see data from the last 2 months. Note: all reports are in UTC (coordinated universal time).
- Interval - The interval is how data is grouped within a timeframe. When you are viewing trending metrics you can adjust the interval of your report. This allows you to choose whether you want to see change over time on daily, weekly, or monthly basis For example, If you select a timeframe of “Last 60 Days” and then select, “Daily” interval; there will be 60 data points. If you select, “Weekly” interval there will be 8 data points. Lastly, if you select, “Monthly” interval, there will be 2 data points.
Export Analytics reports
To export your report's raw data to a CSV file, click the Download button in the top right corner of your report view within the Admin Portal and the report will be sent directly to your email address!

Click through the demo below to learn!
Watch the demo below to learn!
Note
When exporting a report, completion times may vary based on the amount of data on the report. Hang tight and be sure to check back a bit later! If you don't receive the report that day, please contact help@getro.com.